.png)
PortalTalk Analytic services
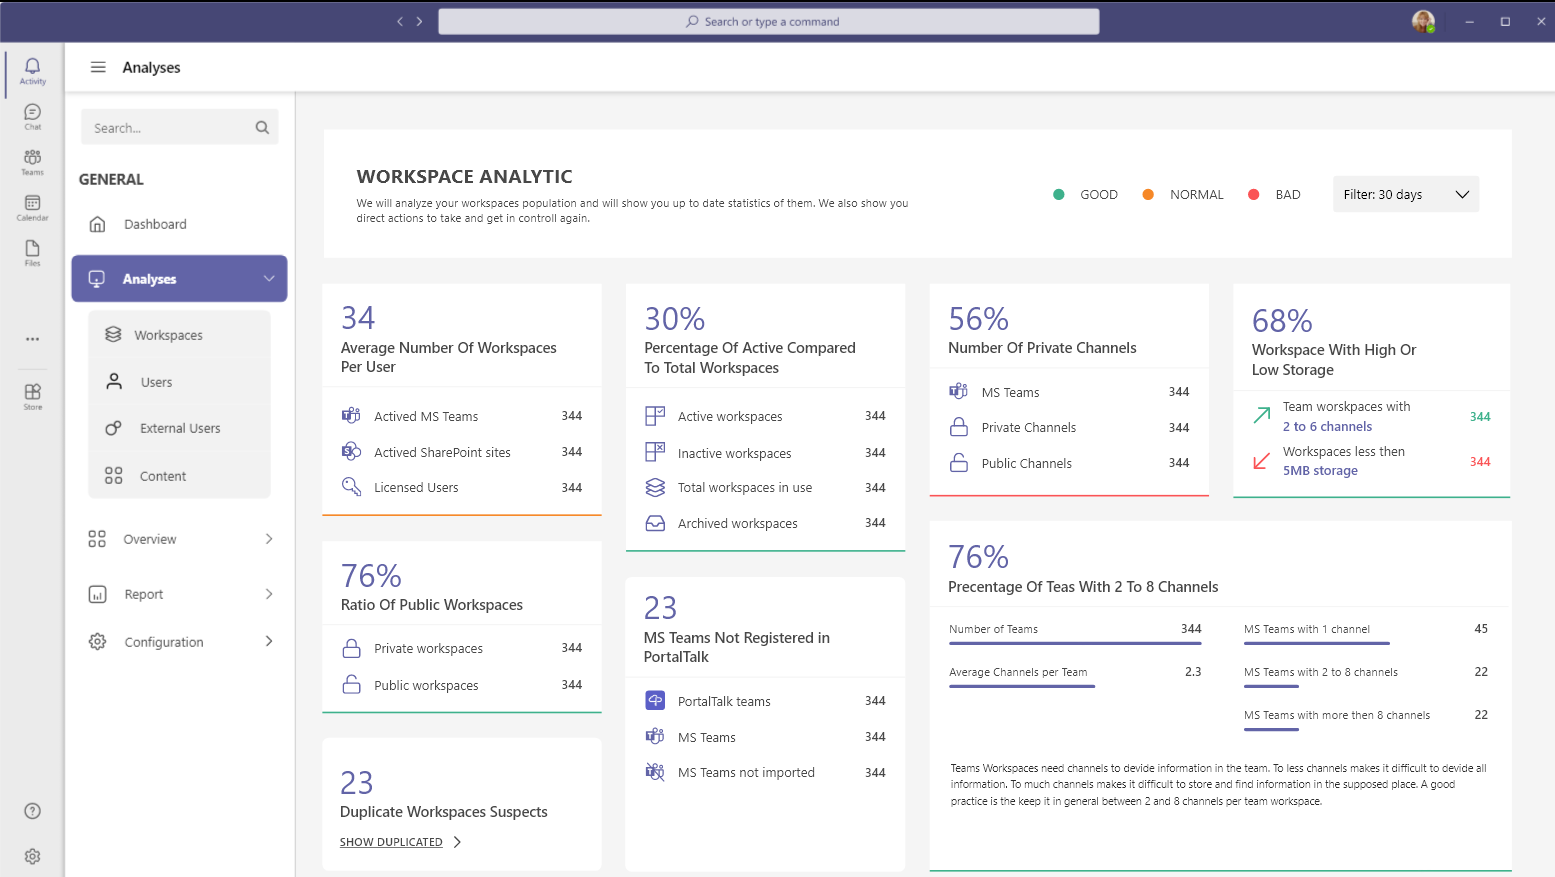
Analytics shows you the current state of your MS Teams and SharePoint collaboration environment. It presents you a set of KPI boards showing insights on different topics. Green, Yellow en Red colors are used to quickly show you the status of a KPI.
Most of the KPI boards shows actions as well. These actions will help you to directly start to improve or solve the addressed issue and to get the KPI back to Green again.
Normally you should expect to present these KPI’s to PortalTalk admins. Of course we do. But, we will also present a set of Analytic KPI actions to the end-users. This will help them to improve their collaborative behavior, offered as a self-service feature.
Analytics for the Admin
The Admin KPI’s are shown in several subjects, divided into these categories :
-
Workspaces
-
Users
-
External Users
-
Content
Analytics for the User
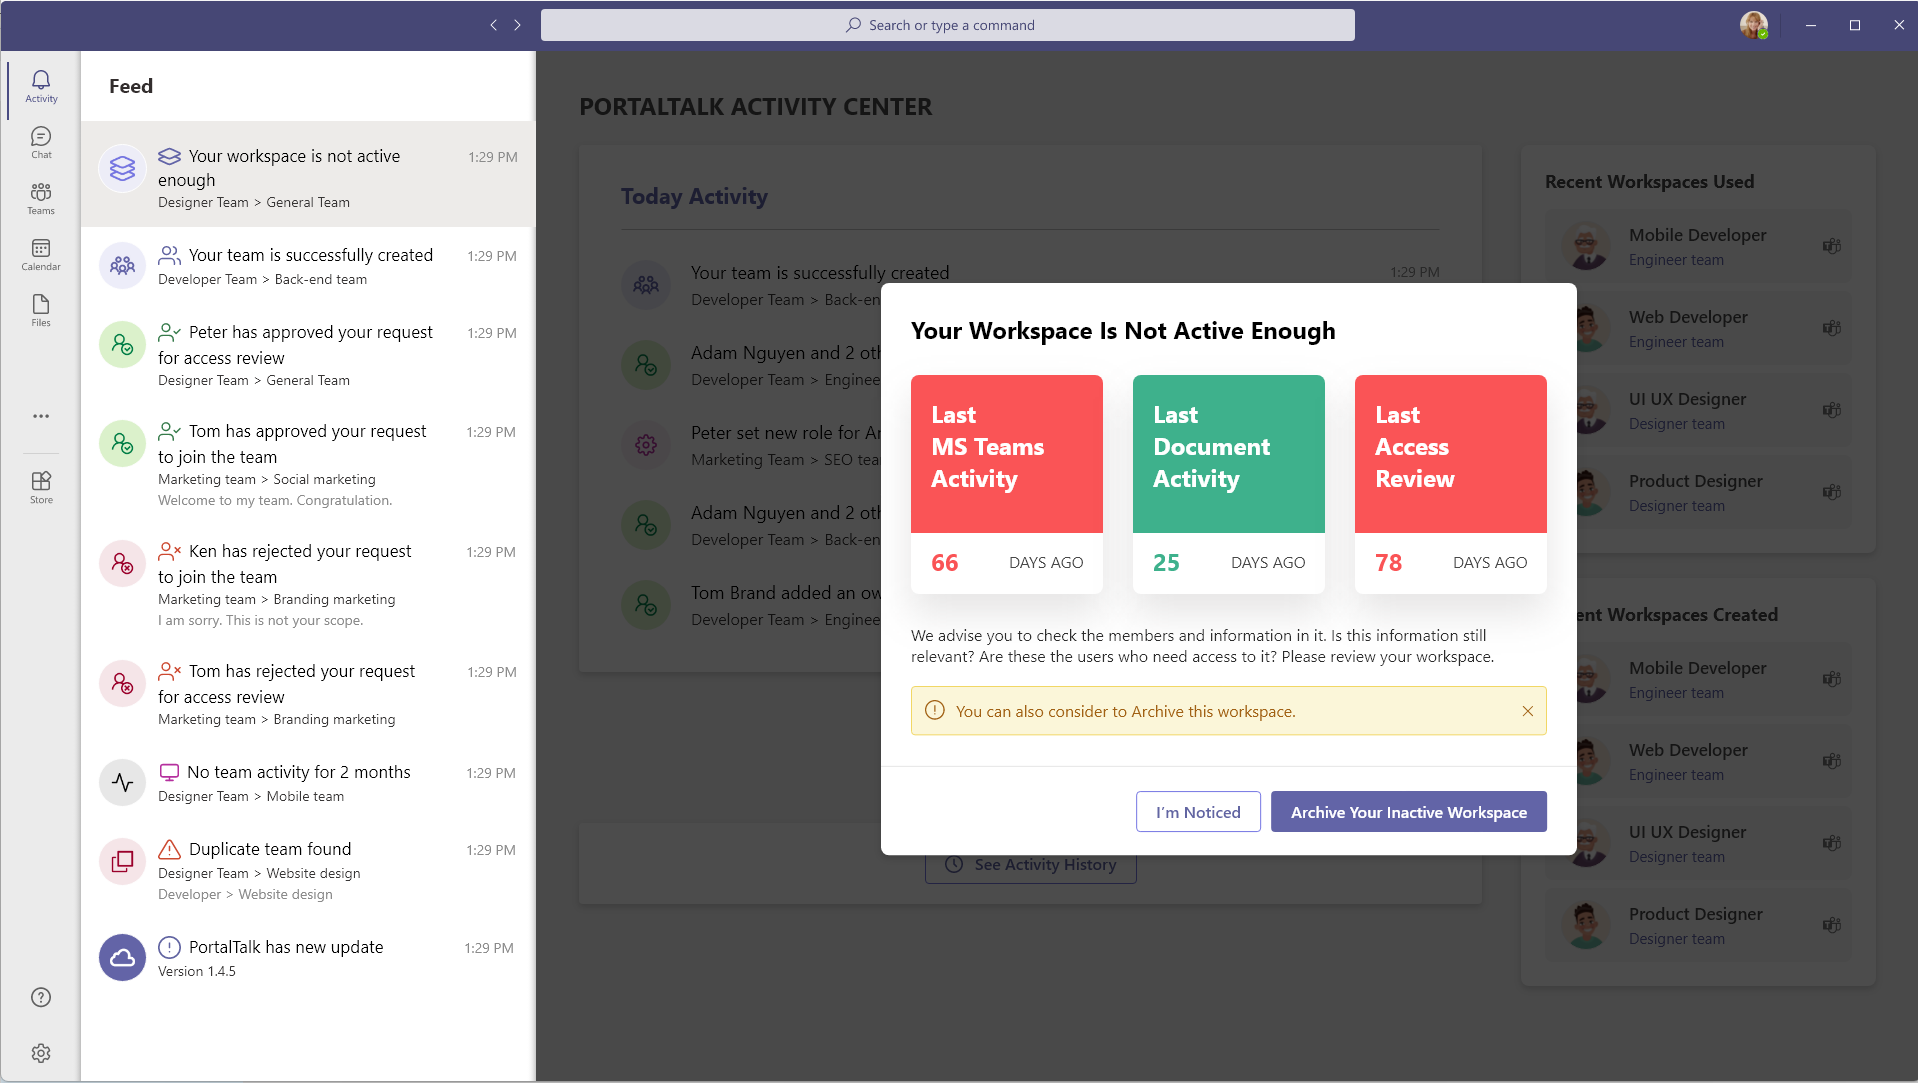
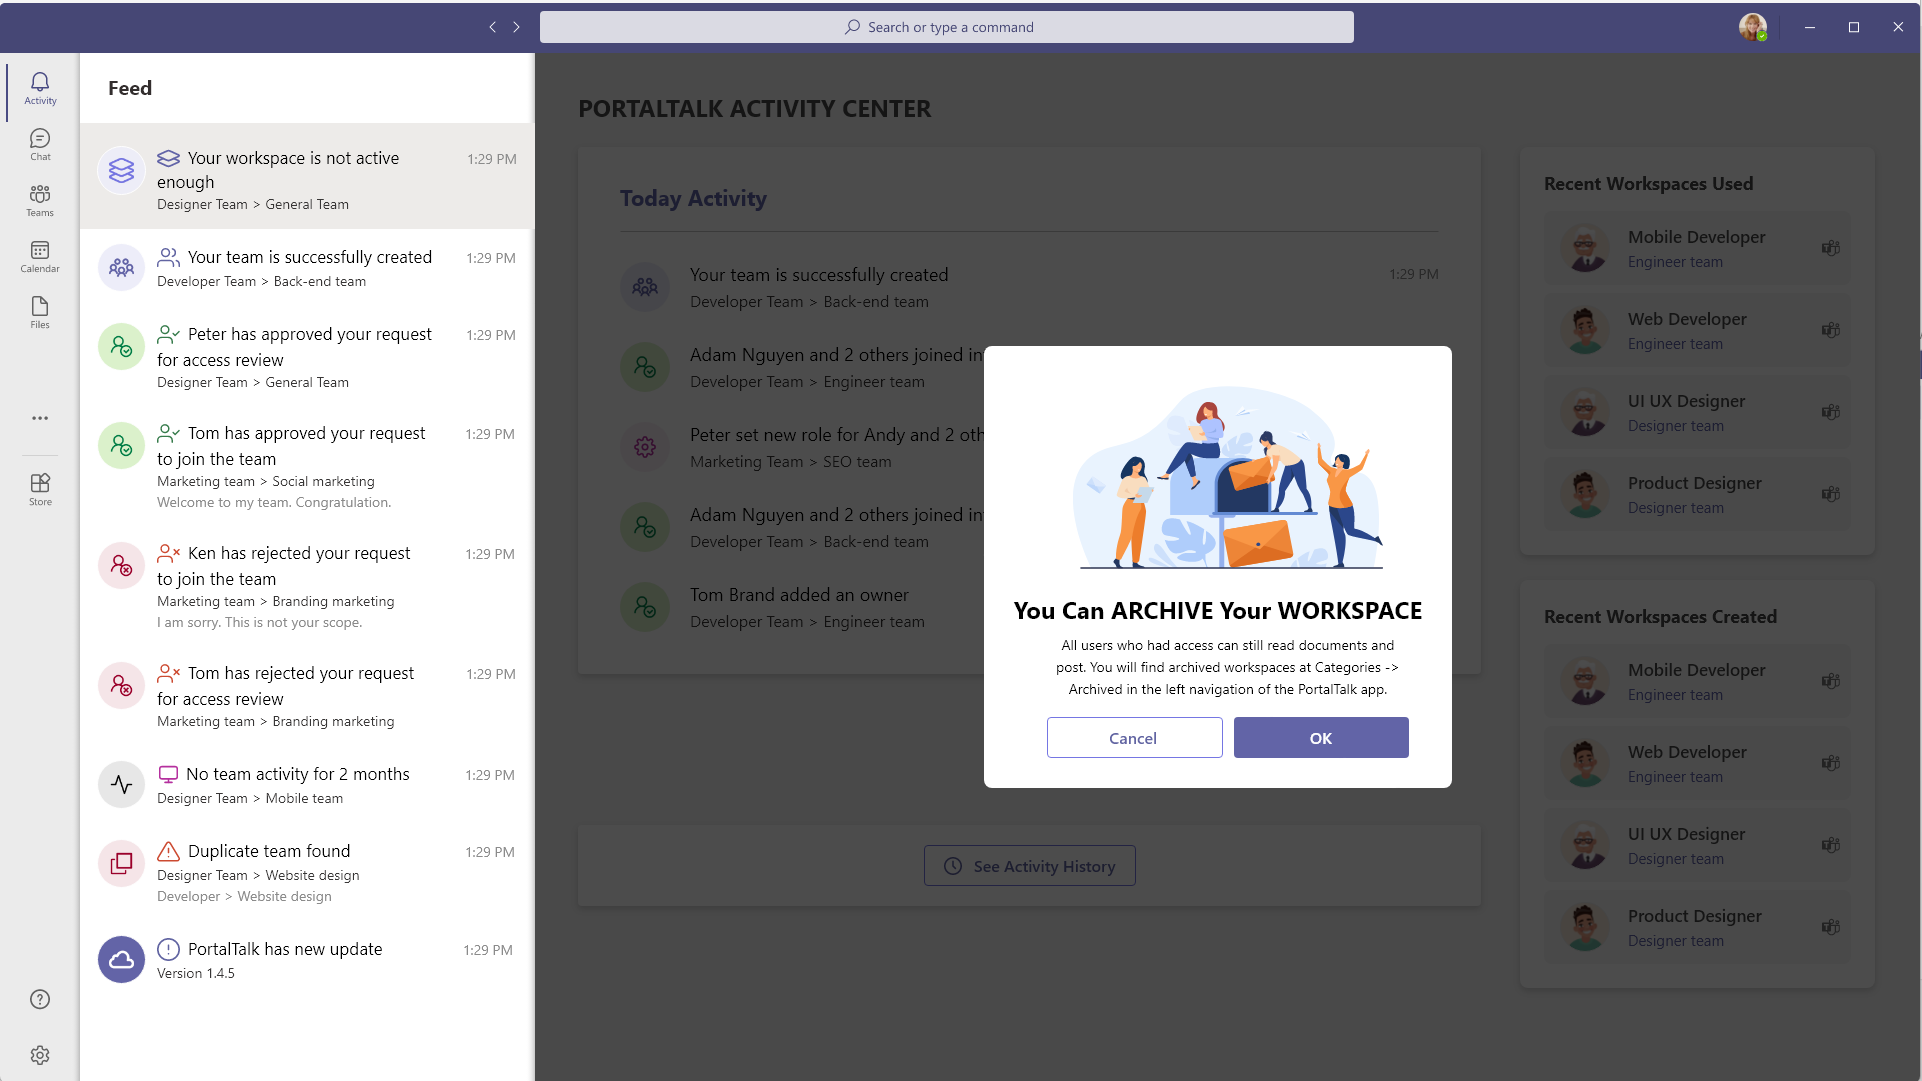
‘Analytics for the Users’ are presented as MS Teams activities. User will see them as part of the normal daily MS Teams activity feed. It’s important to not over-feed the end users with PortalTalk activities. So, Analytic KPI activities are only sent to users if they met certain criteria of a KPI. Furthermore, you are able to set the frequency a KPI will be processed (1 to 6 months). If criteria of a specific KPI are met, the Analytic KPI activity will be sent to the user.
The activity can be opened, just as every MS Teams activity. The user gets instant insight and prove of the signaled deviation. An action is presented to overcome the issue.