.png)
Now the Analytics services are configured, it’s time to see the first results. Keep in mind that first results are only shown after the first data collection has been done. When you configure the service for the first time, it can take up to 1 week before the first data is collected. Processing data is always performed during the weekend.
This preview version only show two KPI boards. This will be extended in upcoming releases
Show KPI boards overview
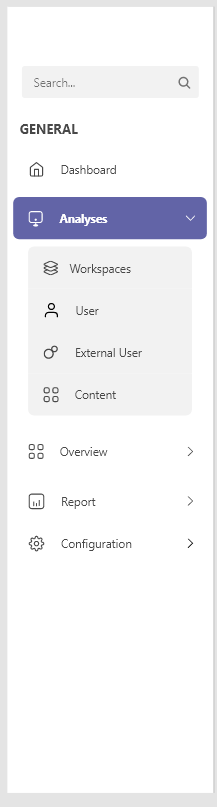
The main Analytics overview for the Admin is shown in the PortalTalk Admin Center. The four categories are shown as menu items
-
In the left main menu, click Analyses → Workspaces
-
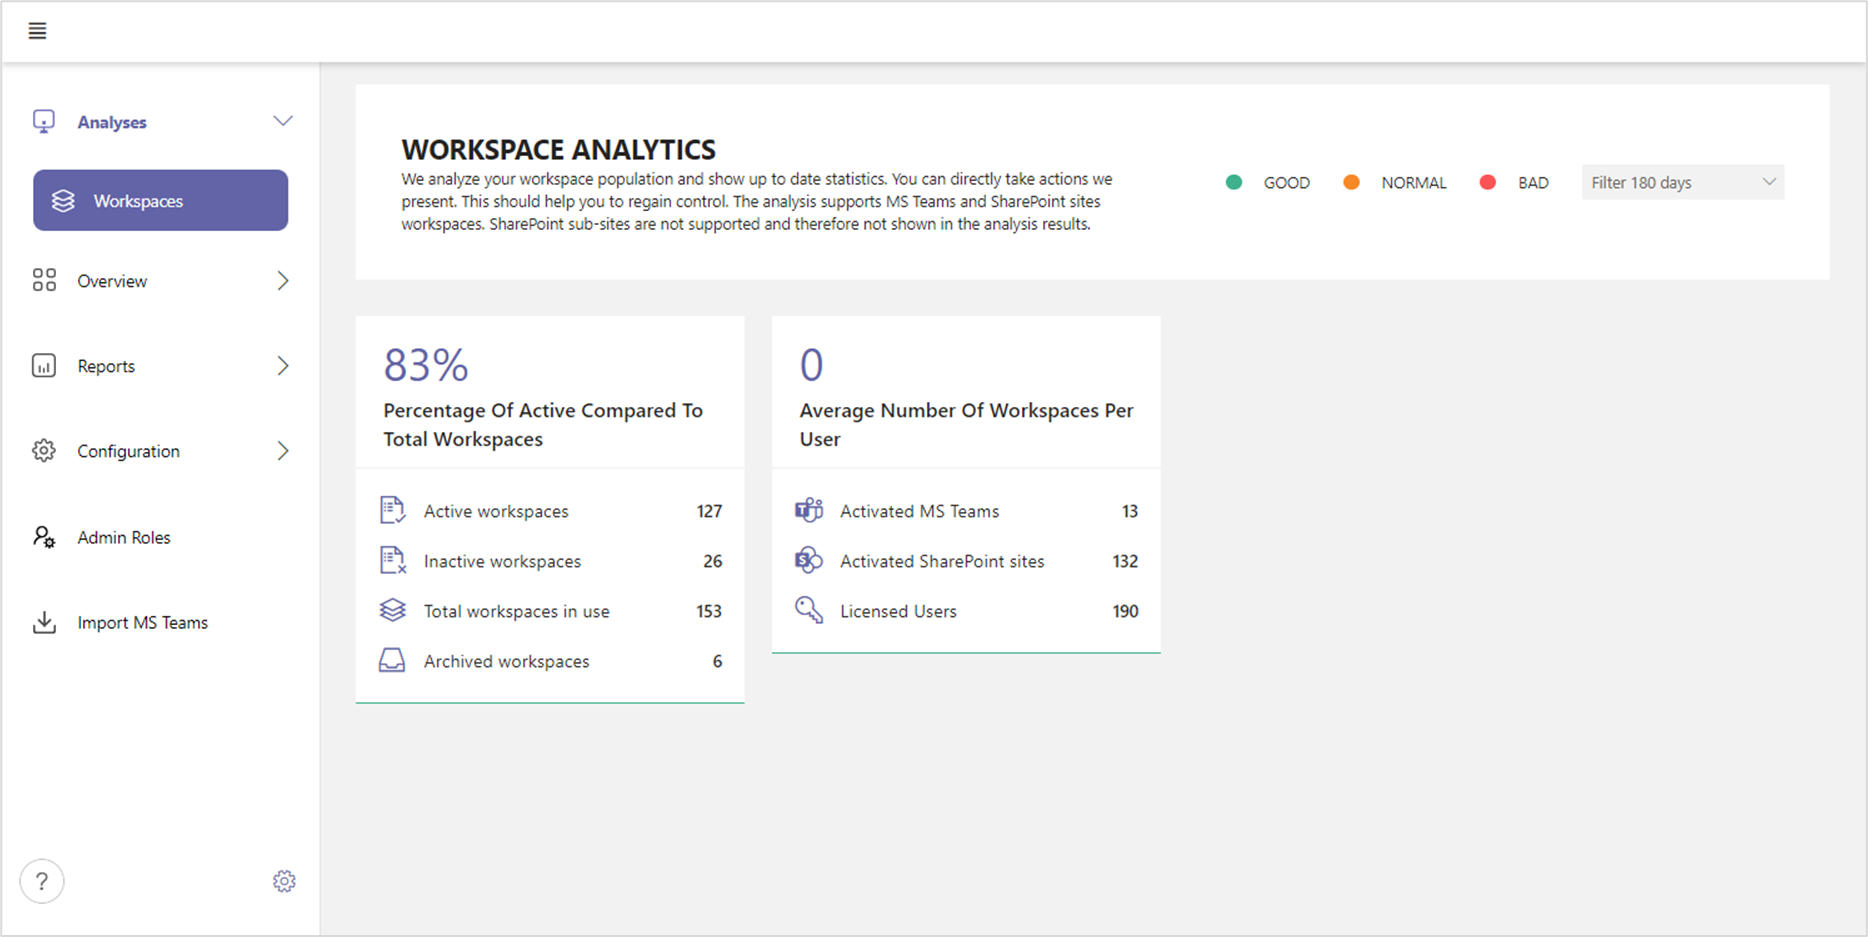
The KPI boards are shown
-
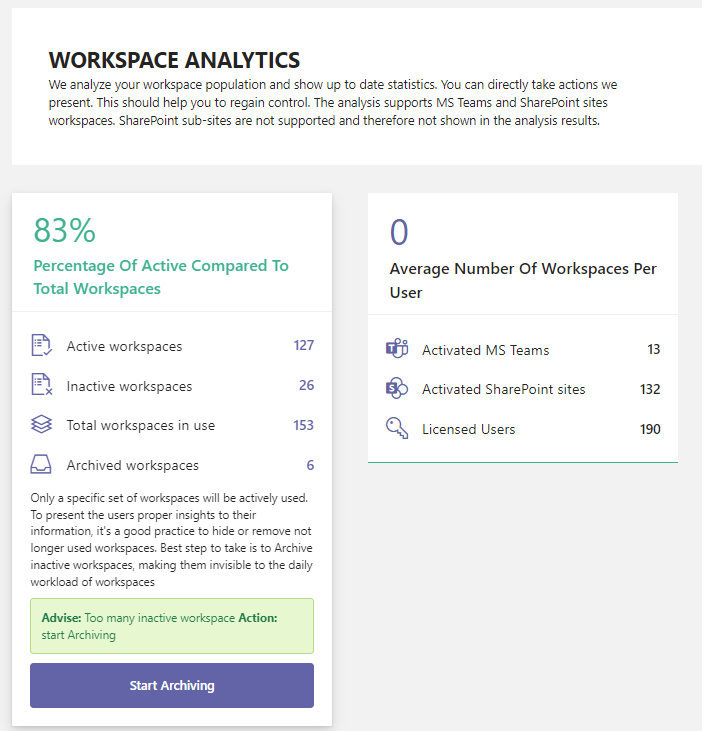
When you click a KPI board, an explanation of the KPI is shown.
-
Also the KPI score (RED, YELLOW, GREEN) becomes visible.
-
An advise is presented to you
-
Also an action button, as first step to overcome this issue and start to improve this KPI, is shown to you
-
This KPI forces you to start archiving inactive teams
-
Click the ‘Start Archiving’ button
-
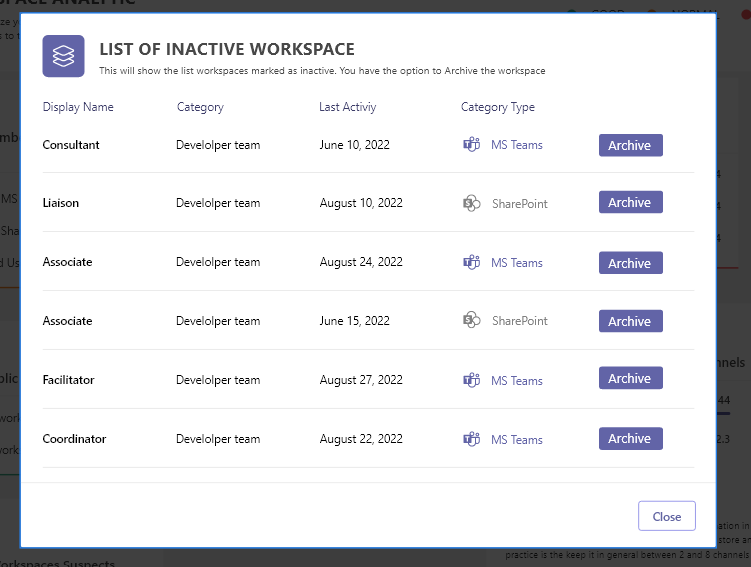
The list of Inactive workspaces is shown, with latest activity on top
-
Now it’s easy to select the appropriate candidate workspace to Archive
-
Just click the ‘Archive’ button to start archiving
-
You can repeat this action for more workspaces