.png)
The PortalTalk Analytics services standard operation is set to OFF. To configure the service please go to the PortalTalk Admin Center. You should have the PortalTalk Admin role to do the configuration of Analytic services.
Admin Analytic base configuration
-
Open ‘Configuration’
-
Click ‘Admin Analytics’
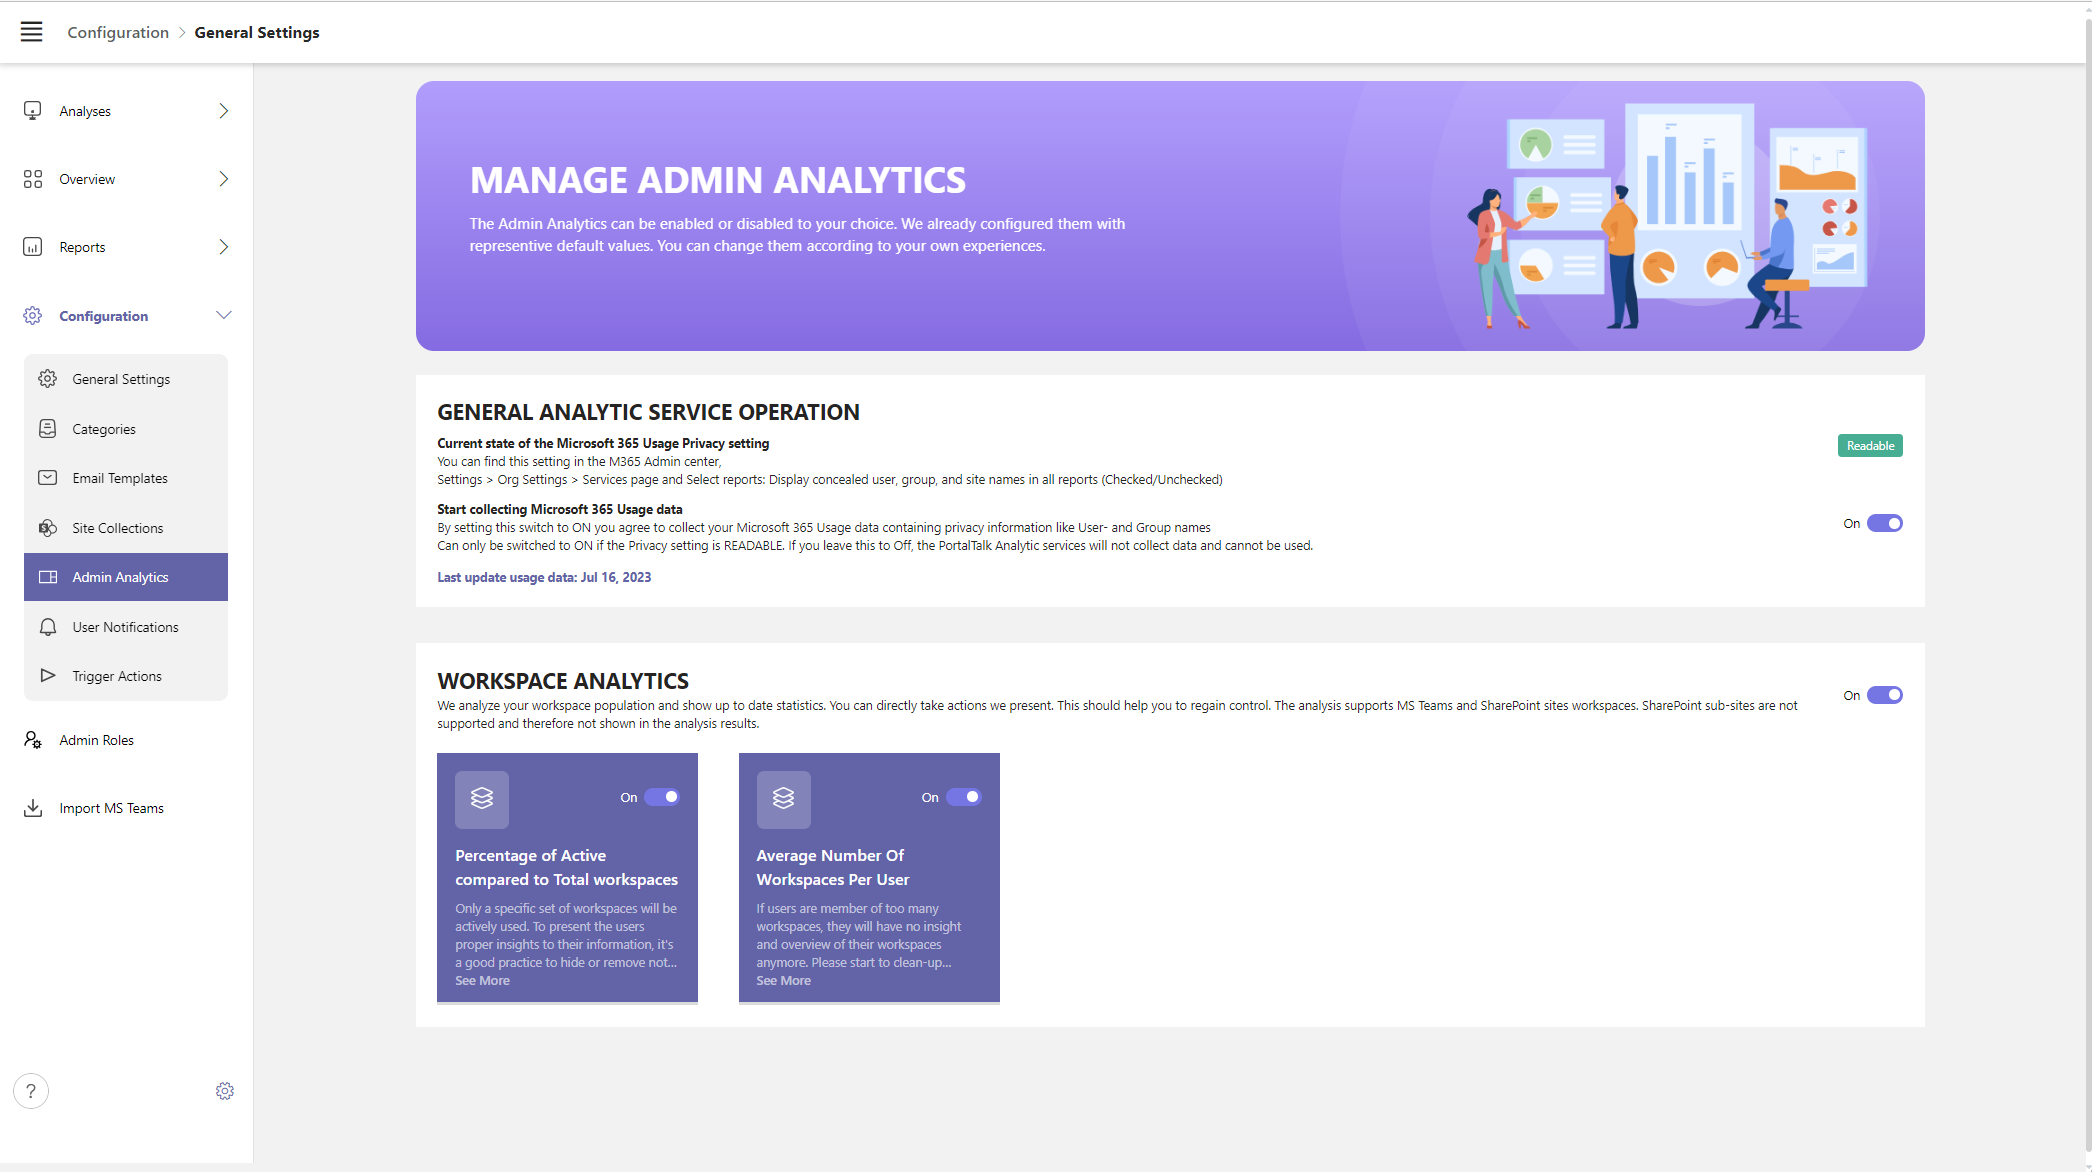
First you have to configure the general analytic service settings
-
Please check if ‘Current state of the Microsoft 365 Usage Privacy setting’ shows the green status ‘Readable’
If this shows a red value ‘Not Readable’ then this analytic service cannot be used. This Microsoft 365 switch controls the privacy settings of user- and workspace names of the Usage Reports in Microsoft 365.
-
You can find this setting in the M365 Admin center; ‘Settings > Org Settings > Services page and Select reports: Display concealed user, group, and site names in all reports (Checked/Unchecked)'
-
To control this setting, please logon to your tenant with an account where the ‘Global Admin’ role is assigned.
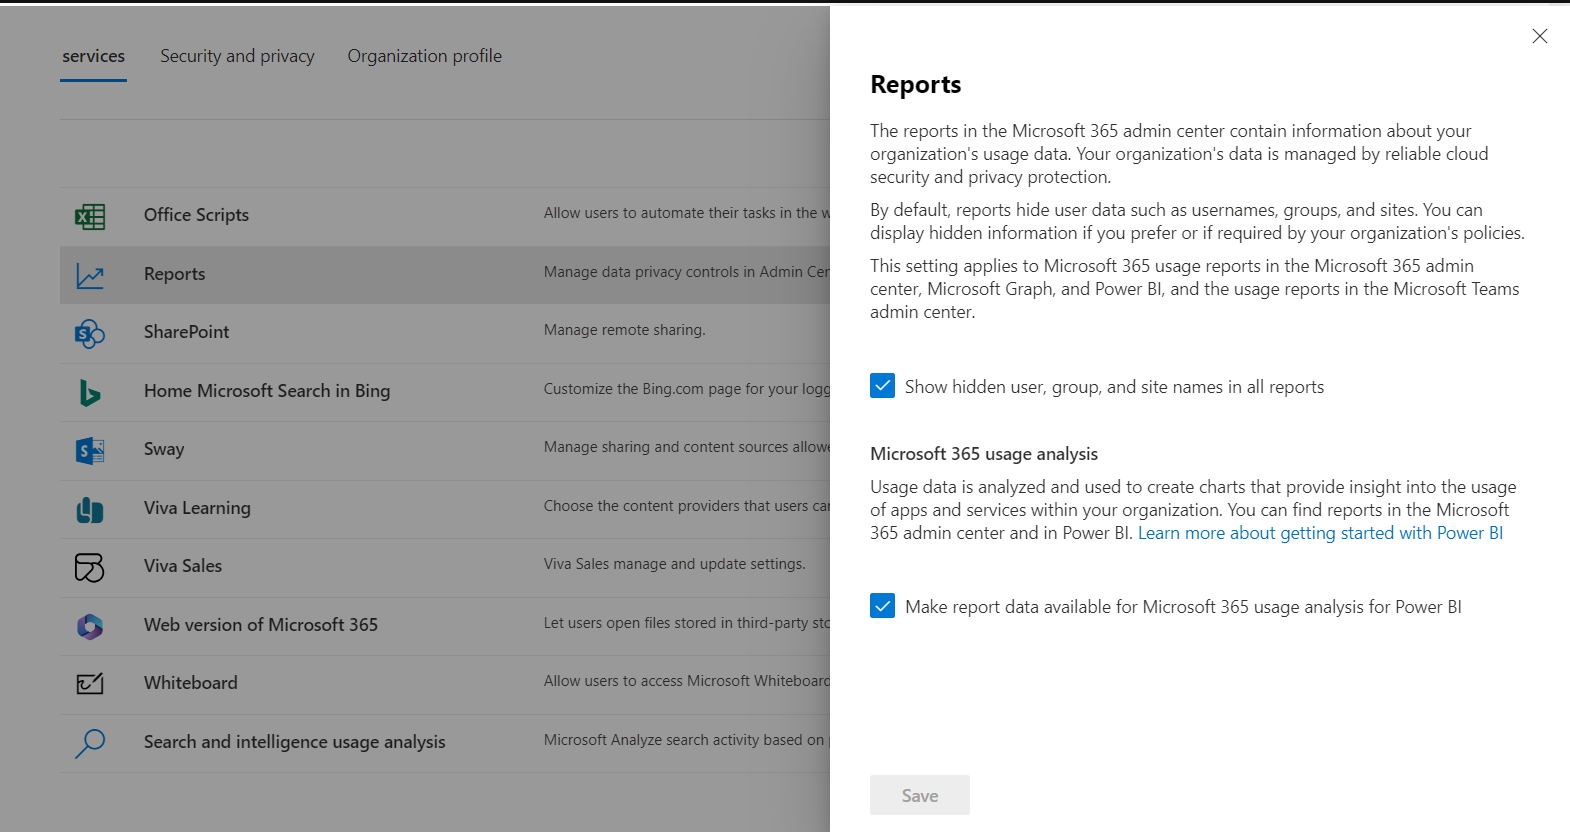
If this switch is set to ‘Checked’, the workspace- and user names are shown in the M365 Usage Reports. This settings is needed to give PortalTalk Analytics service access to this information and clear to option to put the service to ON.

-
Notice that as soon as the Microsoft 365 switch ‘Show hidden user, groups and site names in all reports’ to ‘Checked’, the PortalTalk ‘Start collection Microsoft 365 Usage data’ can be set to ON
-
If you do so, PortalTalk will start to collect the data and start to build the analytic data for you tenant.
Collection of this data will be done once per week during the weekend. So, it could take up to 7 days to collect the data and to present your the first Analytic KPI dashboard.
For you convenience we show the latest date the analytic data was refreshed. Please keep that in account when you interpret the KPI data.
Configure analytic per KPI board
-
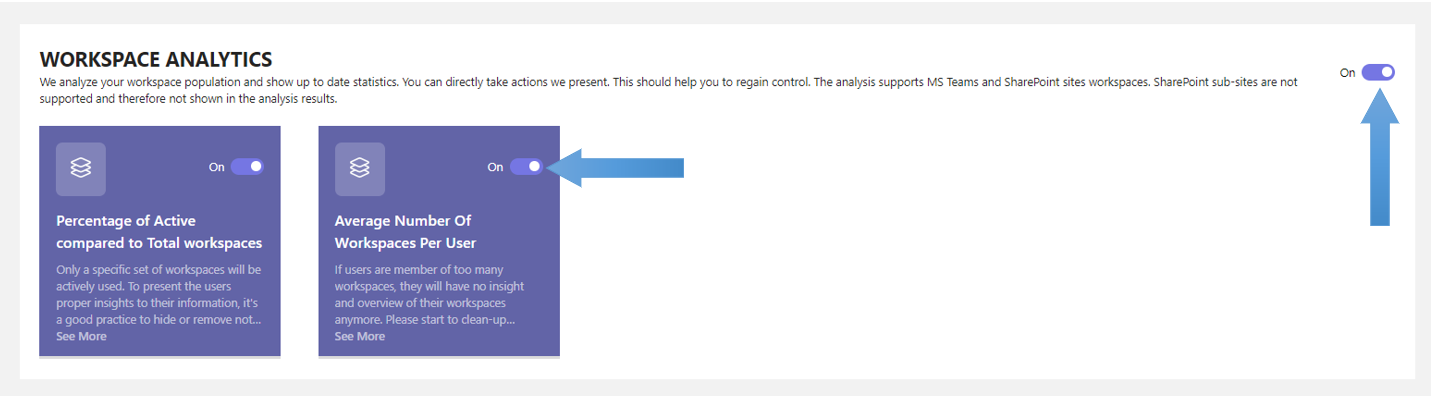
A complete section like ‘Workplaces' can be switched ON or OFF. The KPI parameters can be configured per KPI board.
-
KPI Boards can be switched ON or OFF individual
When you click on a KPI board, the more detailed information is shown. Especially the KPI values are shown.
Every KPI exists of a GOOD (green), Average (yellow) and POOR(red) value
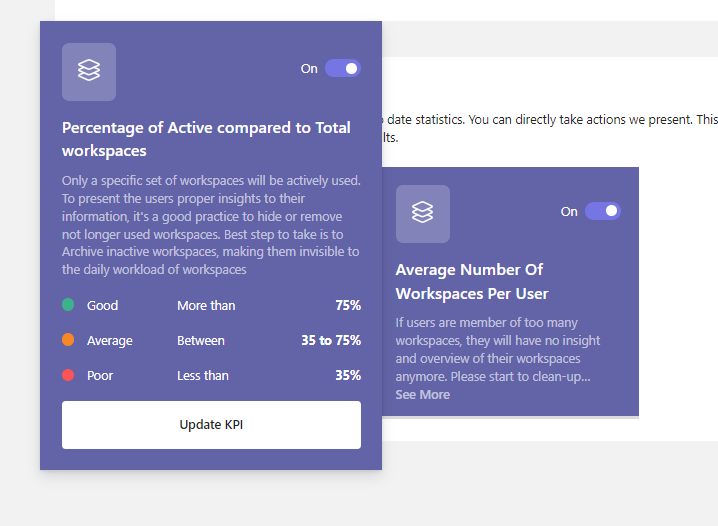
The KPI values can be configured according to you own experiences. We already configured them with values based on our experiences and best practices. Our advise is to first test the analytics by using the default values. If you build some experience with it, you can start to experiment with some other values.
-
Click on ‘Update KPI’ to see and change the values of the KPI
-
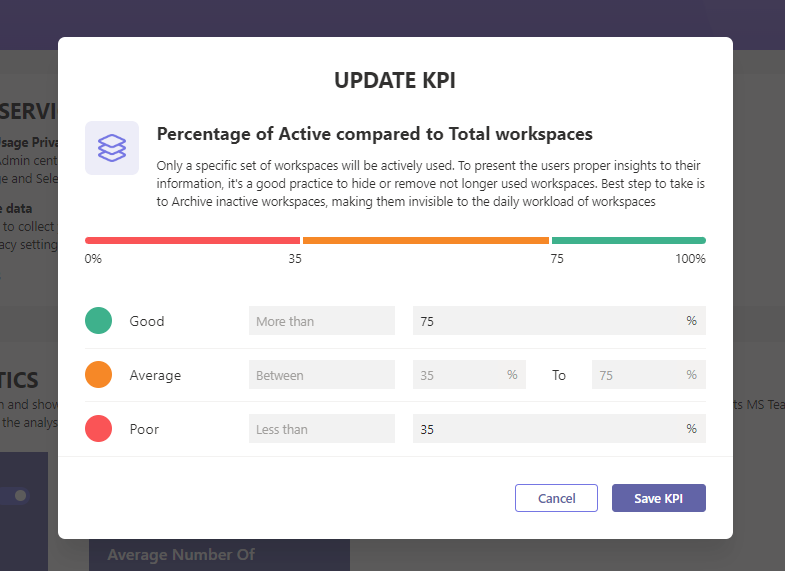
Now you can start entering your own KPI values. Only the GOOD en POOR values can be entered. AVARAGE is calculated automatically.
-
The KPI also protects you from filling incorrect values. It’s not possible to fill incorrect values
-
Please be careful by changing the default values. First build up some expertise by using the default values. Afterwards you can start to make soms small changes.