.png)
The Workspaces KPI boards
KPI is the acronym for Key Performance Indicator, representing a measurable metric of performance over a defined period for a specific objective. With a tool as accessible and easy to use as MS Teams, there is a risk of losing control. Or in this case: the risk of myriad Teams workspaces being created without actually being used.
Workspaces can easily be created over-enthusiastically, and hardly being used afterwards, if at all. These usually contain few or no documents, and show no recent activity.
The PortalTalk Analytic services analyze the entire workspace population and show up-to-date statistics. You can directly take the actions that are suggested. This should help you regain control. The PortalTalk Analytic services support MS Teams and SharePoint Site workspaces. SharePoint sub-sites are not supported and therefore are not shown in the analysis results.
-
Access the PortalTalk Admin Center.
-
Select the navigation option Analyses ➖ Workspaces to access the Workspace Analytics page:
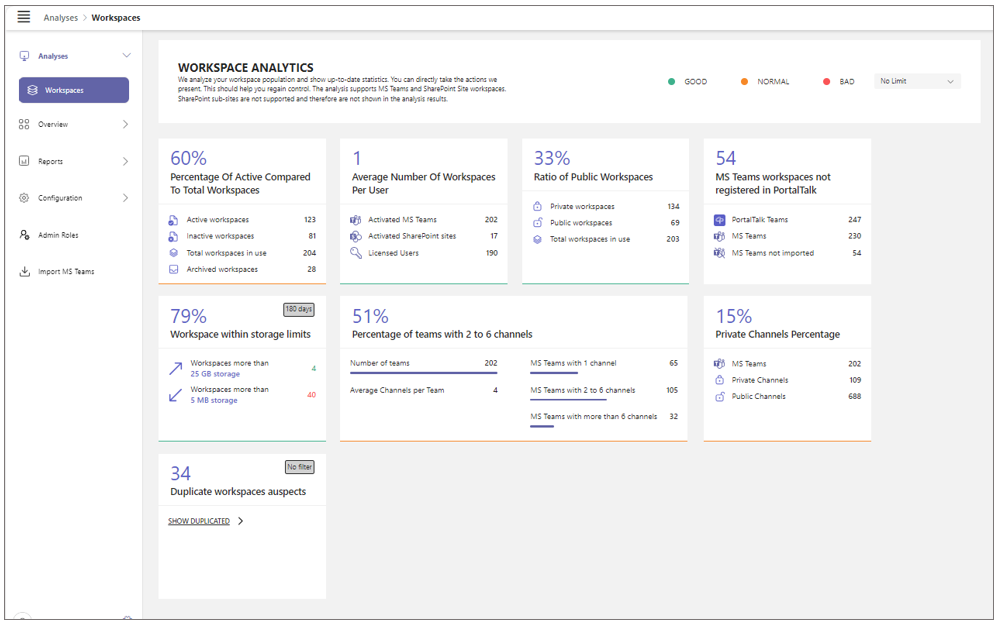
Each KPI board provides statistical information on the efficiency and effectivity of your organization’s Teams workspaces.
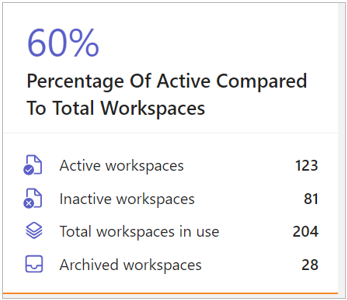
The bottom edge of a KPI board is colored green, orange, or red to indicate the quality of performance (KPI score).
With the filter function at the top right corner of this page you can narrow down the duration of the past period over which the KPIs are calculated.
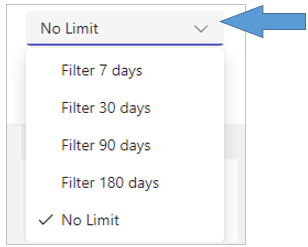
The following Workspace KPIs are offered:
Percentage Of Active Compared To Total Workspaces
The Analytic KPI board on Active/Inactive/Archived Workspaces.
For the KPI board to generate output, the KPI must be activated and configured.
At the top of the board, the ratio of active to inactive workspaces is displayed as a percentage.
A workspace is marked as inactive after a certain number of days have passed without any activity occurring in the workspace. The period of inactivity that determines whether a workspace is to be considered inactive,(30, 60, 90 or 180 days) is determined in the PortalTalk Admin - General Settings.
Further down on the board, the numbers are displayed of respectively the active workspaces, inactive workspaces, total workspaces in use, and archived workspaces.
-
Click the board to obtain an explanation of the KPI and any offered advice:
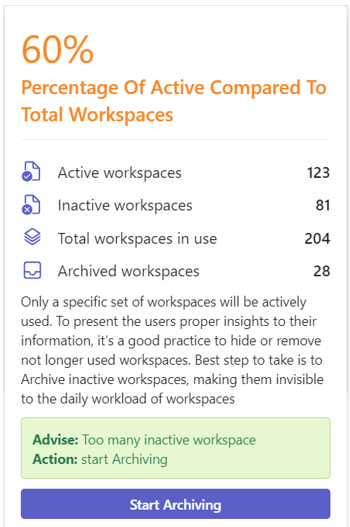
The header of the expanded board is now displayed in the KPI score colour.
The bottom part of the expanded board lists any advice offered and any recommended action.
-
Click the Start Archiving action button to obtain a list of the inactive and least used workspaces.
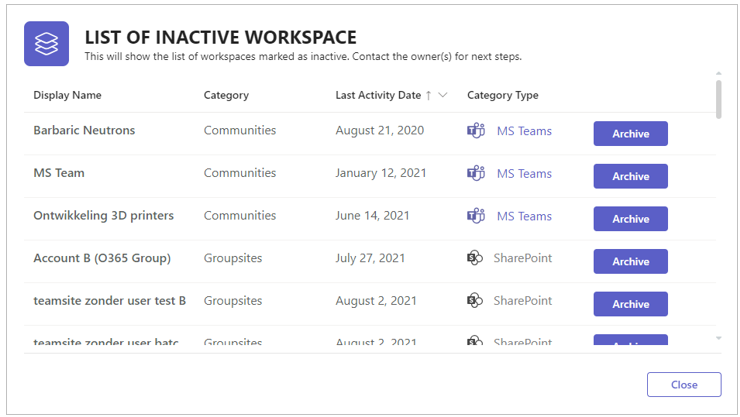
The workspaces are listed in order of inactivity duration, with the longest inactive workspace at the top.
The workspaces are identified by their name, category and category type.
-
Click the Archive button for a workspace in this list, to start the archiving process.
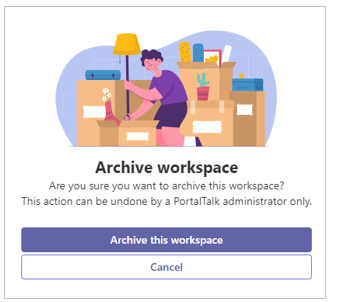
Upon archiving a workspace:
-
The workspace is transferred to the category's Archived subcategory. Archived workspaces are no longer displayed within the subcategories My or Public.
-
The periodic Access Review process is terminated.
-
All external team members are removed from the workspace’s team.
-
All internal team members and the workspace owners are assigned the default permission for archived workspaces - usually Read Only.
Note: The transformations described above can only be rolled back by a PortalTalk administrator (see Restore an archived workspace). When an archived workspace is retrieved from the archive by the administrator, the team members are assigned the default internal team member permission. The workspace owner must then re-invite any external team members and also restore any additional user permissions.
Average Number Of Workspaces Per User
The Analytic KPI board on Average Number of Workspaces per user.
For the KPI board to generate output, the KPI must be activated and configured.
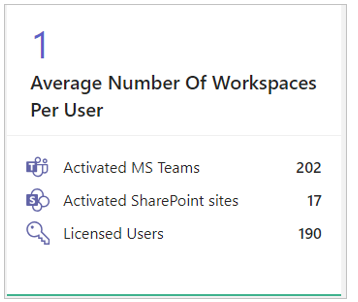
At the top of the board, the average number workspaces per user is displayed.
This to monitor if your organization does not have too many workspaces in use and end-users can still oversee and handle the number of workspaces they work on daily.
Further down on the board, the numbers are displayed of respectively the activated MS Teams, the activated SharePoint sites, and the licensed users.
-
Click the board to obtain an explanation of the KPI and any offered advice:
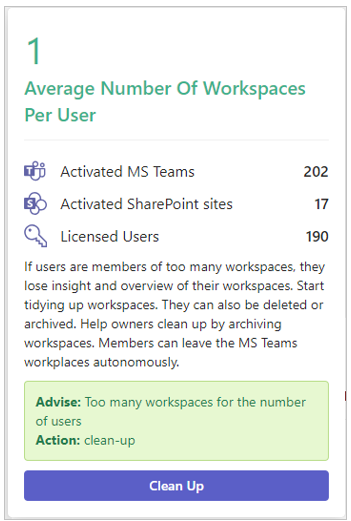
The header of the expanded board is now displayed in the KPI score colour.
The bottom part of the expanded board lists any advice offered and any recommended action.
-
Click the Clean Up button to obtain a list of the inactive and least used workspaces.
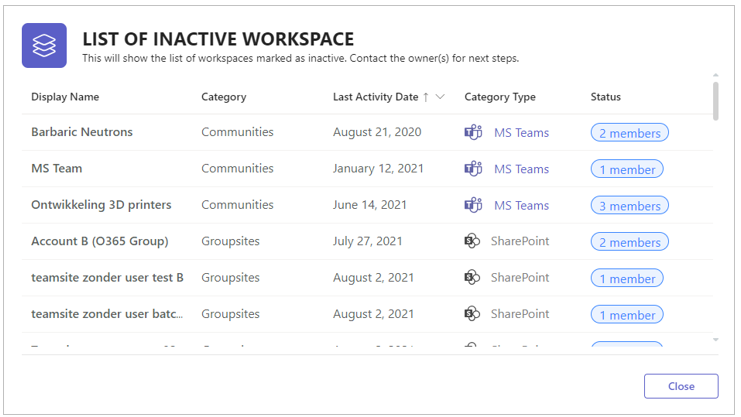
The workspaces are listed in order of inactivity duration, with the longest inactive workspace at the top.
The workspaces are identified by their name, category, date of last activity, category type, and number of team members.
Ratio of Public Workspaces
The Analytic KPI board on Ratio of Public Workspaces.
For the KPI board to generate output, the KPI must be activated and configured.
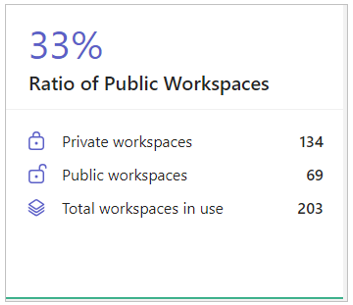
At the top of the board, the percentage is displayed of the public workspaces compared to the private ones.
Further down on the board, the numbers are displayed of respectively the private workspaces, the public workspaces, and the total number of workspaces.
Public workspaces can be accessed by all members of the organization.
This KPI indicates how open is the organization. It is up to management to judge this KPI. Working in a MS Teams environment probably should reflect the modern way of collaboration, providing access to information as much as possible for every user in the organization.
-
Click the board to obtain an explanation of the KPI and any offered advice:
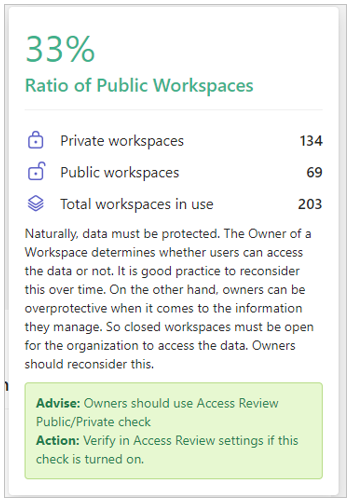
The header of the expanded board is now displayed in the KPI score colour.
The bottom part of the expanded board lists any advice offered and any recommended action.
The Access Review Public/Private check must be activated as a Category Setting.
Ensure that the category setting Public or private is checked. This will notify the workspace owners of the privacy status of their MS Team workspace when performing the Access Review and allow them to make immediate adjustments.
MS Teams workspaces not registered in PortalTalk
The Analytic KPI board on workspaces not registered to PortalTalk.
For the indicator board to generate output, it must be activated.
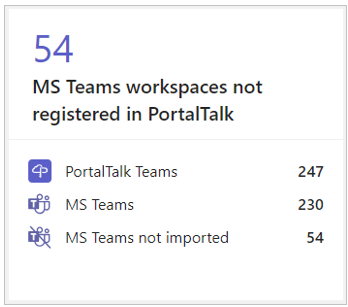
At the top of the board, the number is displayed of the MS Teams workspaces used within the organization, that are not registered in PortalTalk.
Further down on the board, the numbers are displayed of respectively all workspaces registered in PortalTalk, the MS Teams workspaces registered in PortalTalk, and the MS Teams workspaces not registered in PortalTalk.
Your organizations uses PortalTalk. Therefore, all team workspaces should be managed through PortalTalk. This KPI makes it clear if this is the case.
-
Click the board to obtain an explanation of the KPI and any offered advice:
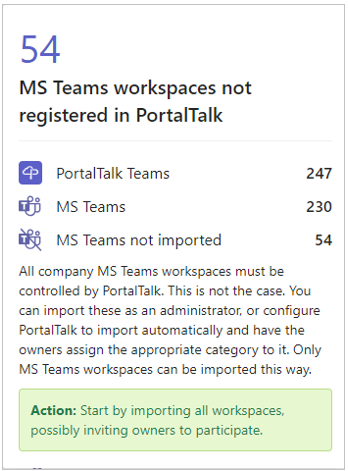
The bottom part of the expanded board lists any recommended action.
Consult the online manual page Incorporating MS Teams into PortalTalk for an instruction on how to import MS Teams workspaces into PortalTalk.
Alternatively, consider enabling the auto-import feature in the PortalTalk General Settings - Auto import MS Teams not registered to PortalTalk. This functionality empowers the workspace owners to assign their imported MS Teams to the workspace category and workspace type of their choice.
Workspaces within storage limits
The Analytic KPI board on workspaces with high or low data storage.
For the KPI board to generate output, the KPI must be activated and configured.
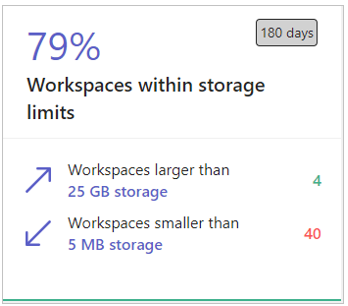
At the top of the board, the percentage is displayed of the workspaces within the storage limits of 5 MB and 25 GB.
This KPI gives you insight into the organizational behavior of your users. The data used to calculate this KPI is sourced from the preceding 180 days only.
Modern work entails working in a balanced set of workspaces. Too few data dispersed across many workspaces typically points to inactivity and lack of overview. Conversely, having only a few workspaces with extensive data storage resembles a traditional departmental file share which hampers flexible collaboration.
Further down on the board, the numbers are displayed of respectively the workspaces larger thane 25 GB and the workspaces smaller than 5 MB.
-
Click the board to obtain an explanation of the KPI and any offered advice:
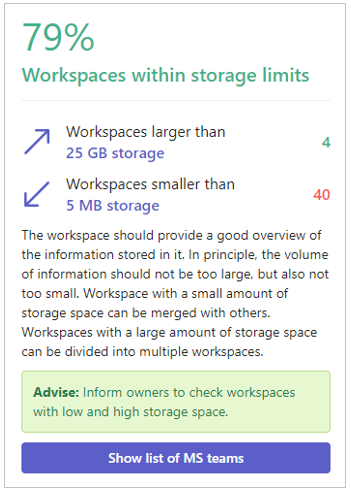
The header of the expanded board is now displayed in the KPI score colour.
The bottom part of the expanded board lists any advice offered and any recommended action.
-
Click the Show list of MS teams button to obtain a list of the workspaces that do not meet the storage limits.
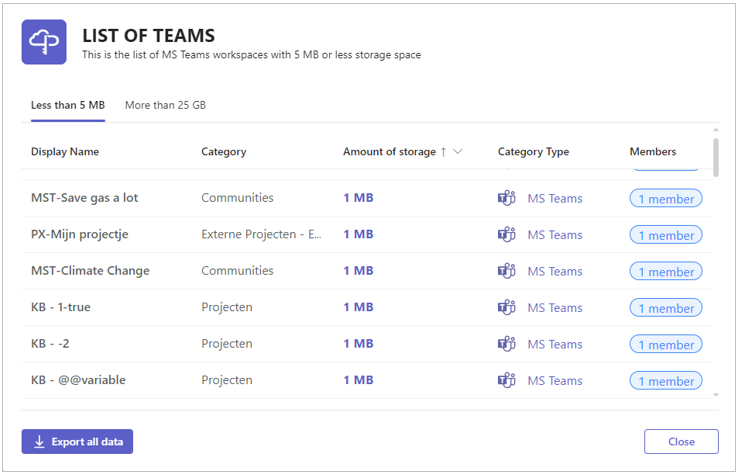
The workspaces displayed are divided over two tabs: Less than 5 MB and More than 25 GB.
The workspaces are listed in order of storage size, and are identified by their name, category, storage size, category type, and number of team members.
-
Click the Export all data button to obtain the information in an Excel file.
Percentage of teams with 2 to 6 channels
The Analytic KPI board on workspaces exhibiting either low or high numbers of channels.
For the KPI board to generate output, the KPI must be activated and configured.
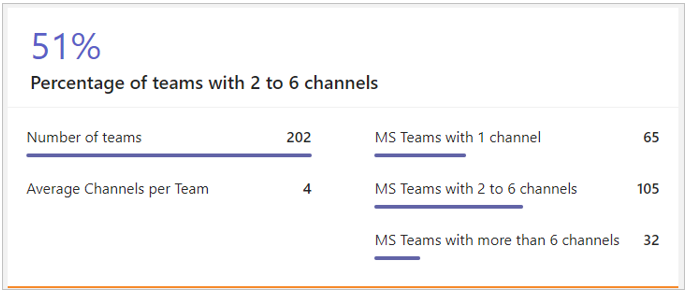
At the top of the board, the percentage is displayed of the workspaces with two to six channels.
Further down on the board, the numbers are displayed of respectively the workspaces larger thane 25 GB and the workspaces smaller than 5 MB.
The purpose of channels is to segment information within a Microsoft Teams workspace. Our practice learns that the optimal number of channels is 2 to 6. The board provides you with more information about teams that are outside of the 2 to 6 channel limits.
-
Click the board to obtain an explanation of the KPI and any offered advice:
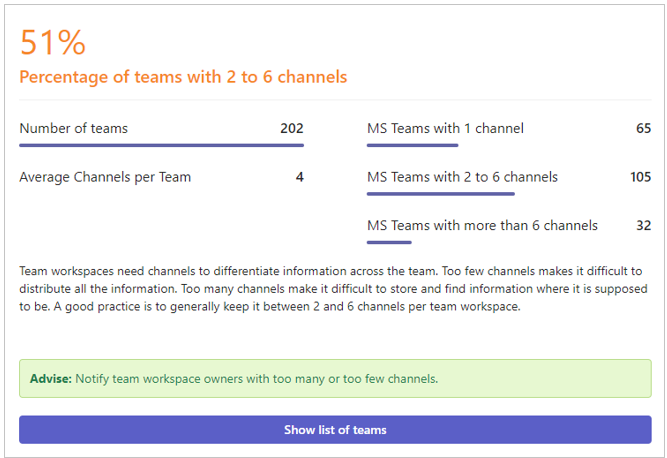
The header of the expanded board is now displayed in the KPI score colour.
The bottom part of the expanded board lists any advice offered.
-
Click the Show list of MS teams button to obtain a list of the MS Teams workspaces that do not meet number of channels limits.
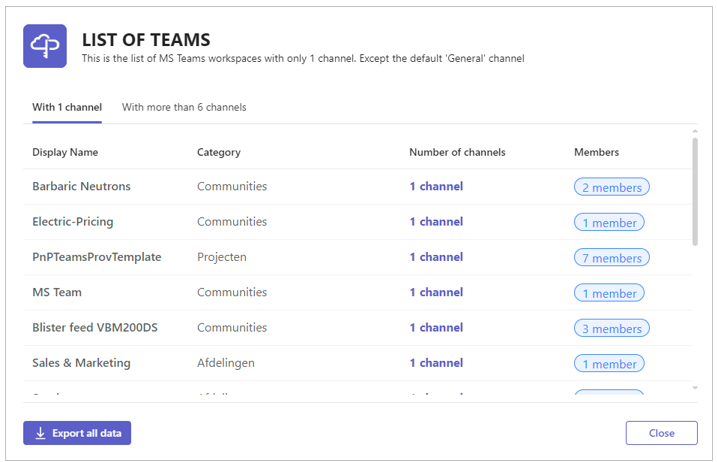
The workspaces displayed are divided over two tabs: With 1 channel and With more than 6 channels.
The workspaces are identified by their name, category, number of channels, and number of team members.
-
Click the Export all data button to obtain the information in an Excel file.
Private Channels Percentage
The Analytic KPI board on workspaces where information is managed and stored within Private Channels.
For the KPI board to generate output, the KPI must be activated and configured.
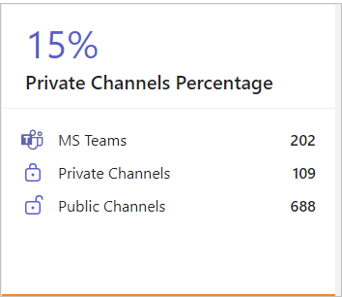
At the top of the board, the percentage is displayed of private channels used in all the active team workspaces.
Too many private channels in teams workspaces is behavior we aim to prevent. Users are hiding information for team members. To make information accessible to them all, the percentage of public channels should be high in which case the KPI will show up in Green.
Further down on the board, the numbers are displayed of respectively the total of teams workspaces, the total of private channels, and the total of public channels.
-
Click the board to obtain an explanation of the KPI and any offered advice:
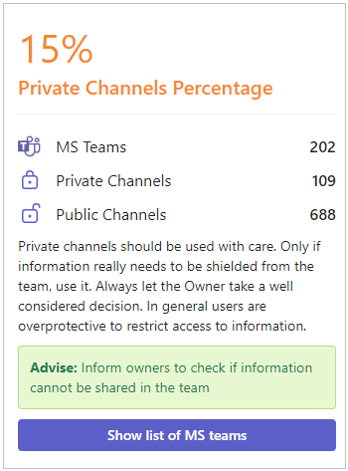
The header of the expanded board is now displayed in the KPI score colour.
The bottom part of the expanded board lists any advice offered and any recommended action.
-
Click the Show list of MS teams button to obtain a list of the workspaces containing private channels.
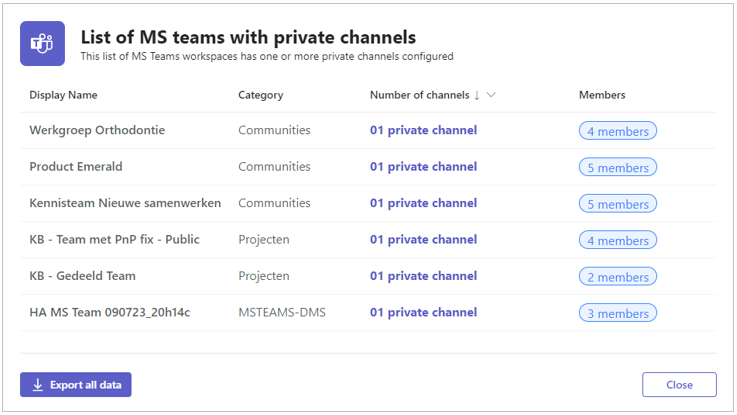
The workspaces displayed are ordered on the number of contained private channels.
The workspaces are identified by their name, category, number of private channels, and number of team members.
-
Click the Export all data button to obtain the information in an Excel file.
Duplicate workspaces suspects
The Analytic KPI board Admin Analytic KPI on suspected duplicate workspaces.
For the indicator board to generate output, it must be activated.
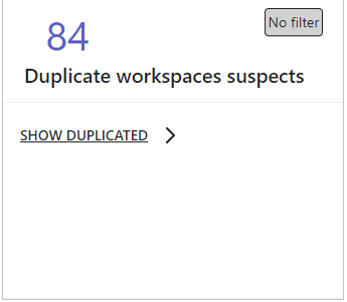
The KPI board displays the number of workspaces that may have one or more suspected duplicate versions. Duplicates are only analysed with the workspaces in the same Category. So, the same workspace name can exist in different Categories. This behavior is the same at the similarity check during Request or Create of a workspace.
A continuous insight into any suspected duplicate workspaces is essential to prevent the proliferation of identical team workspaces, commonly referred to as 'team-sprawl'.
Any filter settings on the Workspace Analytics page are not applied to this KPI.
-
Click the board to obtain an explanation of the KPI and any offered advice:
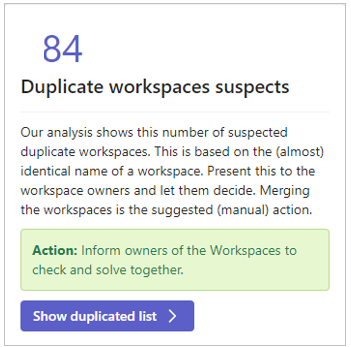
The bottom part of the expanded board lists any advice offered and any recommended action.
-
Click the Show duplicated list button to obtain a list of all the workspaces that may have one or more suspected duplicate versions.
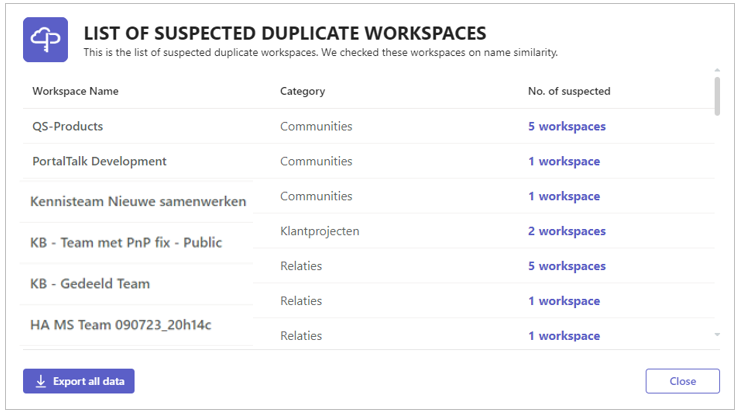
Each workspace is displayed with its category and the number of its suspected dubplicates.
Click the number of suspected duplicates to obtain a list of these suspected duplicates.
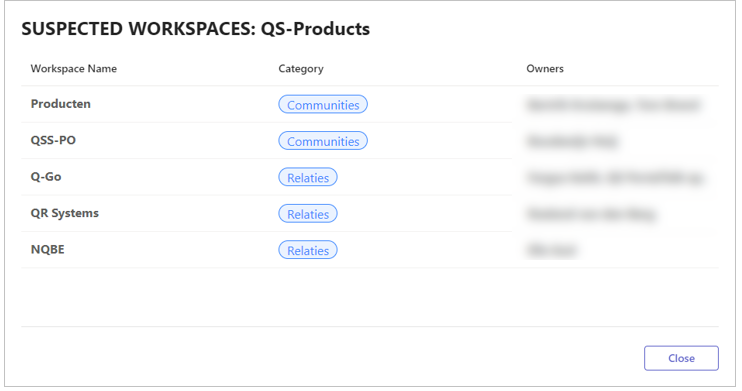
The suspected duplicate workspaces are identified by their name, category and owner(s).
-
Click the Export all data button to obtain this information in an Excel file.